So, time to get cracking with the data I've gathered so far.
This is Excel Dyno's input screen. I've boxed in red the required input data:
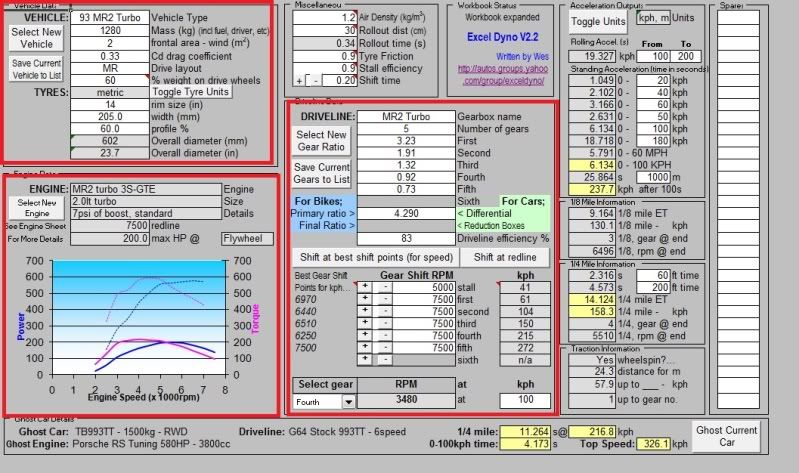
The top box "Vehicle" requires all the vehicle specific information. Note that % weight on the rear wheels is not equal to the weight distribution of the car. Since this program simulates the car accelerating in a straight line, the actual % weight should also take weight transfer to the rear wheels into account. I've calculated this based on the assumption that the static weight distribution of the RX-7 is 50/50, the CG is located at 1/3 of the total height of the car and a longitudinal acceleration of 0.5G.

I couldn't find any information regarding the FD3S's frontal area. be it the 93-99 or the 99+ version. All i could find out was that it was "revised" for the face-lift. Danke very much. Since it is a vital part of the simulation (the program neglects air resistance if this data isn't provided) I've had to guesstimate it based on whatever information i could find about other cars. I am aware that this will generate a significant amount of error compared to real world results. However, since this value is kept constant throughout the comparison, it does not affect the outcome of the test.
Note: While looking for data regarding frontal area, i came across various forum threads which suggested this could be measured. Either by working on the car with a tape measure, or by heating the car's body in the oven and throwing it against a huge block of cheese to measure the imprint. While i can understand that most people don't care about how big the surface that moves the air is on their car, it's a pity the information isn't readily available to enthusiasts.
On to the engine
 Excel Dyno requires the construction of power and torque curves through a table as you can see on the left. There is an option to specify whether the input data is power to the wheels or flywheel, further adding to the accuracy of the test and saving the user precious time. The problem is unless you dyno the car yourself and input the data acquired (which is probably the way the program is intended to be used) it is extremely rare to find horsepower and torque curves with values in table format on the net. Fortunately however I don't actually need a torque curve, since the program calculates torque automatically (yes, in case you didn't know horsepower is a function of torque) There are plenty of dyno charts to choose from online and one website seems to have collected a fair few of them: http://www.catenet.net/dyno.php
There is an embarrassing level of choice, from 20B to 13B engines, with varying level of modifications (all declared) and age. I tried to choose a relatively stock 13B with a little over 10psi of boost and a smooth curve, and ended up selecting this:
http://www.catenet.net/graph.php?car177=1&SUBMIT=GRAPH
which belongs to Bill Setter. Congrats Bill on the nice looking graph.
Once entered in the program, it looks like this:
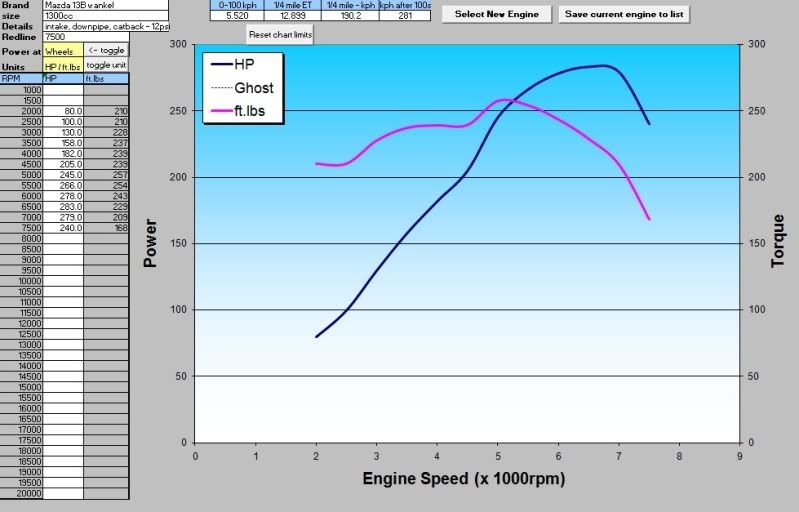
The generated torque curve seems to duplicate the behavior of the stock twins very well, which is a good sign.
And now, the driveline!
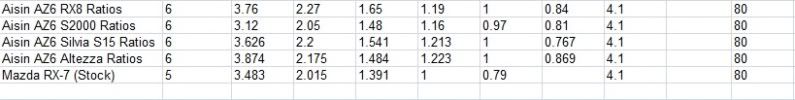
Finding the gear ratios for the cars mentioned in Part 1 was (thankfully) easy. I kept the final drive ratio the same as stock (4.1) in all cases, because as i mentioned earlier, it isn't part of the gearbox but of the differential. This should level the playing field enough to declare a clear winner. Driveline efficiency was set at 80%, roughly standard for a 5/6 speed synchronized manual with trans-axle drive to the rear wheels.
Here is the list of ratios:
Next its play time!
0 Responses so far.
Post a Comment